In my previous post I described how to interface the LM74 SPI temperature sensor to the Beagle Bone and read temperature values at a pre-defined interval. The next step is to present this data in a nice clean fashion.
One of the coolest Python packages that I’ve seen is CherryPy – a very easy to use web server. So, what we are going to do is have a second python application running on the Beagle Bone that will run the CherryPy web server. The server will serve-up our HTML page with a jQuery script. Script, in tern, requests the temperature log data and generates pretty graphs. Sounds complicated but in reality its not. Let’s take a look at all the parts separately.
1) temp_webserver.py – Our second* application that runs on the Beagle Bone.
First one being temp_log.py from previous post.
# ========= IMPORTS =============
import cherrypy
import os
import simplejson
import sys
from time import sleep
#import string
WEB_ROOT = os.path.dirname(os.path.realpath(sys.argv[0])) #Find the directory where the application is launched from
# ============== Main Server Object ======
class TempSensor(object):
# =========== Dictionary of Script commands {Command: number of parameters,...} ============= commands are all lower-case only.
 def __init__(self):
 pass

 @cherrypy.expose
 def GetTempDataJSON(self, LastRecordLoaded):
 LastRecordLoaded = int(LastRecordLoaded)
 print ">GetTempDataJSON " + str(LastRecordLoaded)
 DataList = []
 fTempLog = open(WEB_ROOT+'/temp.log', 'r')
 for lineN, line in enumerate(fTempLog): #Temperature log data is stored in "date;value" format
 if lineN > LastRecordLoaded:
 KeyVal = line.split(";") #split by ";" designator
 KeyVal[1] = KeyVal[1].strip('\n')
 DataList.append((KeyVal[0], KeyVal[1]))
 cherrypy.response.headers['Content-Type'] = 'application/json' # label return structure as 'json'
 return simplejson.dumps(DataList)

 @cherrypy.expose
 def ClearTempLog(self):
 with open(WEB_ROOT+'/temp.log', 'w'):
 pass

# SERVER STUFF - DO NOT TOUCH UNLESS ABSOLUTELY NECESSARY
cherrypy.server.socket_port = 80
cherrypy.server.socket_host = '0.0.0.0'
cherrypy.thread_pool_max = 1
conf = {'/':
 {
 'tools.staticdir.on': True,
 'tools.staticdir.dir': WEB_ROOT,
 'tools.staticdir.index': 'index.html',
 }
}
cherrypy.quickstart(TempSensor(), config=conf)
Meat of the application is the TempSensor class that includes two methods GetTempDataJSON and ClearTempLog. Both of these methods have a @cherrypy.expose decorator indicating that they can be called from the outside (jQuery in our HTML page in this example). GetTempDataJSON – returns a JSON formatted list of temperatures with a date&time stamp. ClearTempLog – clears the entire temp.log file.
2) index.html – HTML & jQuery side of things
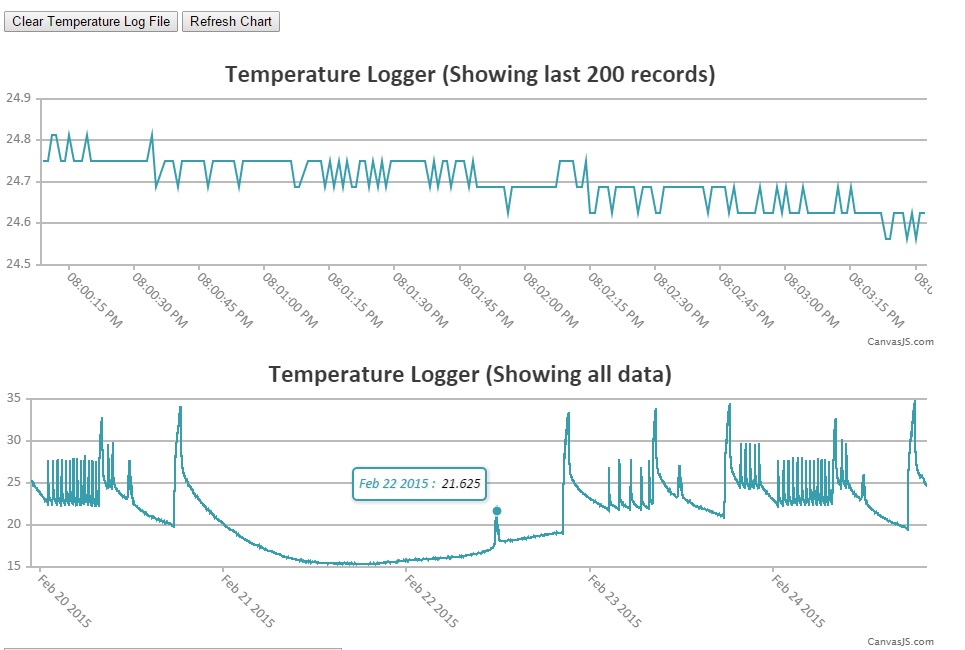
In this demo, the data is presented to the user in two CanvasJS charts. One that is scrolling and shows just the last 200 data points and one that shows all of the data available. Note that I’ve only tested this for a couple days and loading over 400,000 data points into a chart is probably a bit pointless. Even though CanvasJS chart gives you ability to scroll and zoom I think I’m going to sub-sample the data points instead of passing the entire log file.
The few interesting parts of the HTML & jQuery are:
<body>
 <div id='content'>
 <p>
 <input type="button" name="ClearTempLog" id="ClearTempLog" value="Clear Temperature Log File" />
 <input type="button" name="RefreshChart" id="RefreshChart" value="Refresh Chart" />
 </p>
 </div>
 <div id="chartContainer" style="height: 300px; width: 70%;"> </div>
 <div id="chartContainer2" style="height: 300px; width: 70%;"> </div>
 <textarea disabled="disabled" name="DebugText" id="DebugText_ID" cols="45" rows="10"></textarea>
</body>
Above HTML creates two buttons to manually refresh the chart and clear the log file, two divs where that charts will be rendered later on. I’ve also created a text area for debug messages.
    function GetTempJson(){
        $("#DebugText_ID").val("loading data...");
        $.post('/GetTempDataJSON',{"LastRecordLoaded":LastRecordLoaded}, function(data){
            var ChartData = [];
            var dataPoints = [];
            var dataSeries = { type: "spline", color: "#F08080", };
            $.each(data, function(index, val){
                LastRecordLoaded++;
                $("#DebugText_ID").val("Last record# loaded = " + LastRecordLoaded+"\n");
                $("#DebugText_ID").val($("#DebugText_ID").val() + "Records loaded = " + data.length)
                if (LastRecordLoaded > Chart1XRange){
                    dps1.shift();
                }
                dps1.push({
                    x: new Date(val[0]),
                    y: parseFloat(val[1])
                });
                dps2.push({
                    x: new Date(val[0]),
                    y: parseFloat(val[1])
                });
            });
            chart1.render();
            chart2.render();
        });
    };
Function GetTempJson requests temperature log data, parses it, populates the Data Point Sets for the two charts and renders them. One thing to note is that $.POST calls the CherryPy GetTempDataJSON method and passes in the index of the last record that the it has loaded. This way, when the page first loads and class this method, the server will transmit all of the available temperature data. On subsequent auto-refresh operations only the newest set of data has to be transmitted.
Rendered graphs look like this:
Entire project is located at this BitBucket Git repository.